Oklahoma now has the highest incarceration rate in the U.S., unseating Louisiana from its long-held position as “the world’s prison capital.” By comparison, states like New York and Massachusetts appear progressive, but even these states lock people up at higher rates than nearly every other country on earth. Compared to the rest of the world, every U.S. state relies too heavily on prisons and jails to respond to crime.
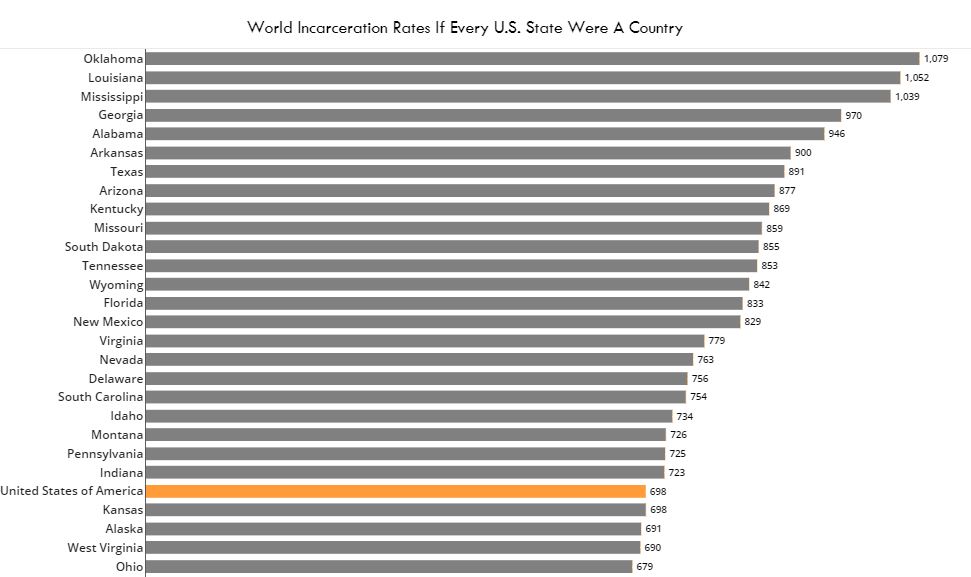
The graphic above charts the incarceration rates of every U.S. state alongside those of the other nations of the world. And looking at each state in the global context reveals that, in every region of the country, incarceration is out of step with the rest of the world.
If we imagine every state as an independent nation, as in the graph above, every state appears extreme. 23 states would have the highest incarceration rate in the world — higher even than the United States. Massachusetts, the state with the lowest incarceration rate in the nation, would rank 9th in the world, just below Brazil and followed closely by countries like Belarus, Turkey, Iran, and South Africa.
In fact, many of the countries that rank alongside the least punitive U.S. states, such as Turkmenistan, Thailand, Rwanda, and Russia, have authoritarian governments or have recently experienced large-scale internal armed conflicts. Others struggle with violent crime on a scale far beyond that in the U.S.: El Salvador, Russia, Panama, Costa Rica, and Brazil all have murder rates more than double that of the U.S. Yet the U.S., “land of the free,” tops them all.
But how does the U.S. compare to countries that have stable democratic governments and comparable crime rates? Next to our closest international peers, our use of incarceration is off the charts:
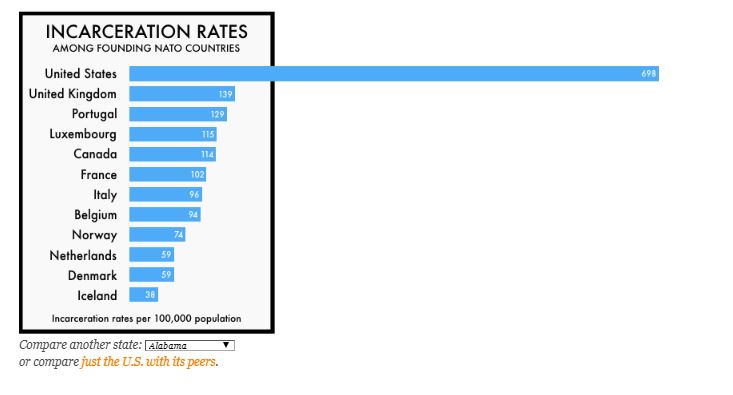
Conclusion
For four decades, the U.S. has been engaged in a globally unprecedented experiment to make every part of its criminal justice system more expansive and more punitive. As a result, incarceration has become the nation’s default response to crime, with, for example, 70 percent of convictions resulting in confinement — far more than other developed nations with comparable crime rates.
Today, there is finally serious talk of change, but little action that would bring the United States to an incarceration rate on par with other stable democracies. The incremental changes made in recent years aren’t enough to counteract the bad policy choices built up in every state over decades. For that, all states will have to aim higher, striving to be not just better than the worst U.S. states, but among the most fair and just in the world.
Methodology
Like our report, Mass Incarceration: The Whole Pie, this report takes a comprehensive view of confinement in the United States that goes beyond the commonly reported statistics by more than 100,000 people to offer a fuller picture of this country’s different and overlapping systems of confinement.
This broader universe of confinement includes justice-involved youth held in juvenile residential facilities, people detained by the U.S. Marshals Service (many pre-trial), people detained for immigration offenses, sex offenders indefinitely detained or committed in “civil commitment centers” after completing a sentence, and those committed to psychiatric hospitals as a result of criminal charges or convictions. They are not typically included in the official statistics that aggregate data about prison and jails for the simple reason that these facilities are largely separate from the state and local systems of adult prisons and jails. That definitional distinction is relevant to the people who run prisons and jails, but is irrelevant to the advocates and policymakers who must confront the overuse of confinement by all of the various parts of the justice systems in the United States.
We included these confined populations in the total incarceration rate of the United States and, wherever state-level data made it possible, in state incarceration rates. In most states, these additions have a small impact on the total rate, and they don’t impact the rankings by more than one or two positions for any state. In a few places, however, these other systems of confinement merit closer attention. For example, although Minnesota has one of the lowest overall incarceration rates, Minnesota is second only to the much larger state of California for civil commitment and detention of people convicted of sex offenses. Other states, including Oregon, Pennsylvania, and Indiana, confine large numbers of youth, to the point that the inclusion of these youth adds more than 20 people per 100,000 to their incarceration rates.
As a result of our choice to take a broader view of incarceration, this report creates a unique U.S. dataset that offers a complete look at all kinds of justice-related confinement in each state. We explain our specific data sources in more detail below and provided the raw data for the component parts of our calculations in an appendix to this report.
Our data on other countries comes from the indispensable Institute for Criminal Policy Research’s World Prison Brief.
A note about the District of Columbia and U.S. territories: This report focuses on comparing individual states to other countries, so we chose to not include the District of Columbia, American Samoa, Guam, Northern Mariana Islands, Puerto Rico, or the U.S. Virgin Islands in the main graphic in this report, although we did make separate NATO comparison graphics for these places. However, the incarceration data for D.C. and the territories, where they exist, are in our appendix and the final incarceration rate calculations for D.C. and the territories are:
| Jurisdiction | Incarceration Rate |
|---|---|
| District of Columbia | 1,153 |
| American Samoa | 340 |
| Guam | 557 |
| Northern Mariana Islands | 529 |
| Puerto Rico | 442 |
| U.S. Virgin Islands | 798 |
Privacy policy
This report requests your location so that we can provide you with a visual comparing your state’s use of incarceration to the founding NATO countries. If you gave us this permission, we discarded your location data as the page finished loading. If you did not give us this permission — or if your browser was configured to decline permission automatically — this report simply makes an educated but unrecorded guess based on your IP address about what state’s data you will find most relevant.
Acknowledgements
All Prison Policy Initiative reports are collaborative endeavors, but this report builds on the successful collaborations of the 2014, and 2016 versions. Beyond the original structure developed by data artist Josh Begley, the authors of this year’s report are particularly indebted to Jordan Miner for helping us offer state-specific graphs, to Joshua Herman for showing us how to add the labels to the main graphic, to Robert Machuga and Elydah Joyce for design assistance, to our colleague Wanda Bertram for feedback, and to the International Centre for Prison Studies for aggregating comparable world incarceration data in the invaluable World Prison Brief.
This report was supported by a generous grant from the Public Welfare Foundation and by our individual donors, who give us the resources and the flexibility to quickly turn our insights into new movement resources.
About the authors
Peter Wagner is an attorney and the Executive Director of the Prison Policy Initiative. He co-founded the Prison Policy Initiative in 2001 in order to spark a national discussion about the negative side effects of mass incarceration. Some of his most recent work includes Following the Money of Mass Incarceration, examining the cost of imprisonment in the U.S., including who benefits and who pays. He is @PWPolicy on Twitter.
Wendy Sawyer is a Senior Policy Analyst at the Prison Policy Initiative. Most recently, she authored Youth Confinement: The Whole Pie and The Gender Divide: Tracking women’s state prison growth.
Peter and Wendy also recently co-authored the Prison Policy Initiative’s report Mass Incarceration: The Whole Pie 2018, which features a series of innovative data visualizations to provide a comprehensive view of the various systems of confinement in the United States.
About the Prison Policy Initiative
The non-profit, non-partisan Prison Policy Initiative was founded in 2001 to expose the broader harm of mass criminalization and spark advocacy campaigns to create a more just society. The organization is known for its visual breakdown of mass incarceration in the U.S., as well as its data-rich analyses of how states vary in their use of punishment. The Prison Policy Initiative’s research is designed to reshape debates around mass incarceration by offering the “big picture” view of critical policy issues, such as probation and parole, women’s incarceration, and youth confinement.
Source: PrisonPolicy.org